Allen “Horntagger” Morris | Originally published in GameKeepers: Farming for Wildlife Magazine. To subscribe, click here.
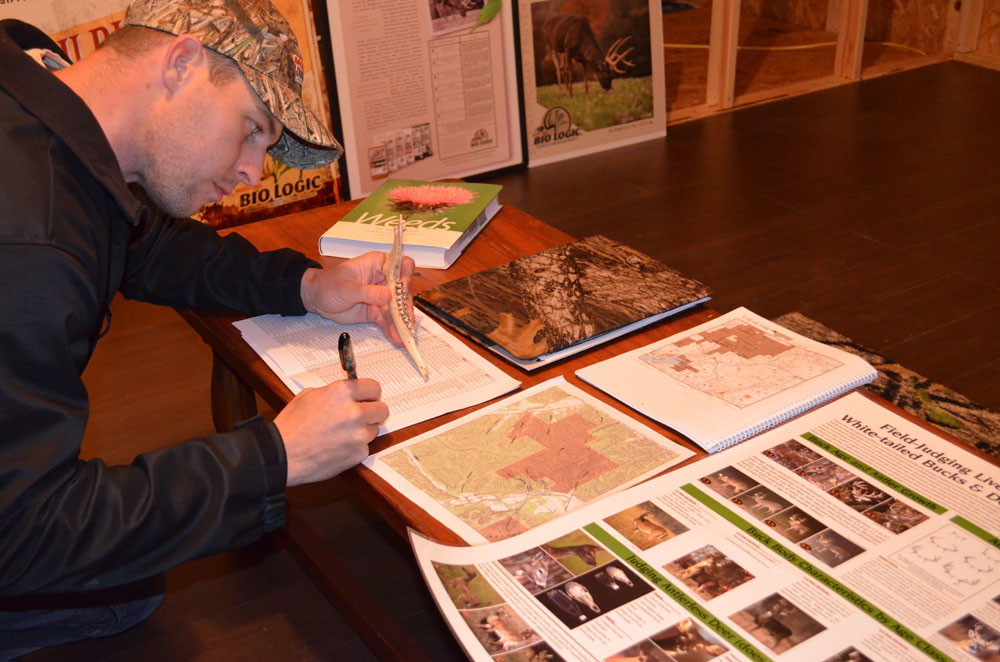
Desk Hunting
One of the most important things a gamekeeper can do is record and analyze information collected from their property. After 30 years of hunting, managing my family property for wildlife for 15 years, and now owning my own property for 8 years, if you wish to make educated decisions on the future of the property you must keep accurate records – this goes for harvest reports, trapping accounts, food plot figures, soil quality changes and more. If you don’t have some type of written record, how can you remember what happened 30 years ago?
You don’t have to be a biologist to learn more about the land or wildlife in your area. By keeping track of the soil tests, planting records, population surveys, observation data, game camera photos, deer movement reports, harvest records, trapping accounts, sheds found and fawning dates as examples, you will begin to see trends, which would otherwise pass you by. This information should become part of your land management plan.
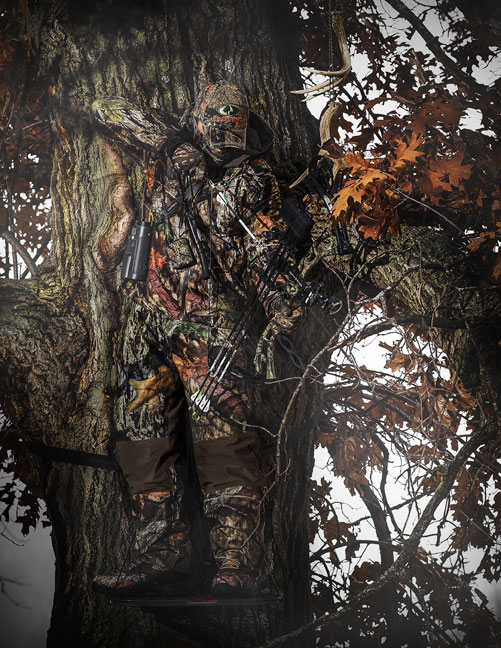
takes a photo of the current sign and the best spot for a treestand. When
he returns to set up an ambush, the sign that was there can be easily
remembered from the photos.
It only takes two or three years to begin to see a pattern, that without your records you may be totally unaware of. That trend may influence you to consider a completely different approach to your management and could have implications on your next hunting season or 30 years down the road.
Another reason for keeping track of the activities on your land is for your kids if you plan on passing the heritage of hunting and land management onto the next generation. This is a great way to show the progress over time of the changes that have happened to your land.
You might not have family to pass your land onto or maybe you plan on buying a bigger piece of land by selling yours. The reason for selling your land really doesn’t matter; however, to help increase the value of your land, or at the very least make your property different from the one down the road, you can provide records for your land setting you apart from the crowd.
You take time to site-in your rifle and practice with your bow – keeping records requires less time than either of those activities - all it really takes is a little time, a notebook and a pen. You can always get more detailed when the season is over and then spend time entering information onto a computer, but when it’s 10 degrees with two feet of snow on the ground, what else are you going to do?
The following are different examples of keeping track of activities and property statistics. Some of these are more important than others, but all help me to make educated decisions on managing my property. You may even think of other categories to record that will help you improve your property for you and future generations.
Photo Journal
In today’s digital age, this is by far the easiest and most fun aspect of keeping land management records. Taking before, during and after photos is something many gamekeepers do. So why not get a little organized with these visual accounts? I have the photos for my property in one folder called “Turkey Buzzard Ranch." After that, I put them into more detailed categories like you see below and then breaking it down further, they are entered into each year’s activity and after that into months. That way I can go back and look at any year and what the food plots looked like that month or how big the turkeys were that we harvested. Examples of photo categories are; deer camp, treestands, game camera, harvest images, food plots, management, aerial photos and sheds.
How can a photo journal help you? For example, the last two years I have gone out and taken photos of deer trails in the snow. As I find crossing trails I mark them with pink flags and then take a photo of a tree where I believe a deer stand should go. Now I can use these photos as a reference of what I was thinking back when I could easily see the deer movement at the time of the year I intend to hunt the site.
I carry a little Nikon Coolpix 16 MP digital camera with GPS and full HD 1080p video with me on my belt, ATV or hunting vest. It is waterproof, shock-proof, freeze-proof and ruggedly built for reliable and comfortable outdoor operation.
Soil Tests
If you have not heard this before, I will repeat it – “Your soil is only one step away from a deer’s mouth.” With that said, can you remember what your first soil test results where? Can you remember how much lime you incorporated or fertilizer you applied? When was the last soil sample taken, and what were the results? You can see in the chart that I use as a reference to the soil’s pH in each plot, how much lime was incorporated and how it changed the soil’s pH.
| Area Name | March-08 | Food Plot Size/Acre | Lime Amount Tons | March-09 | March-12 |
| Main Food Plot | 5.3 | 2.24 | 6.75 | 6.1 | 6.5 |
| Saddle Food Plot | 5.1 | 1.43 | 1.41 | 6.5 | 6.6 |
| Watering Hole Food Plot | 4.9 | 0.57 | 2.17 | 5.8 | 6.4 |
| Bottoms Food Plot | 4.2 | 0.35 | 0.84 | 5.3 | 6.0 |
| Campsite Food Plot | 4.9 | 0.68 | 0.47 | 5.8 | No Test |
Plantings and Minerals
I plan out each year in advance what I want to plant, what rate it needs to be broadcasted at and then I know how much seed to buy. I can go back each spring or fall and look at the year and see what worked best for me. 2012 was the best year out of 8 years for big bucks on my property and I know that year I had planted different types of brassicas in the fall. But I also know that I planted it for 3 years, and so I would not have disease problems with my plants, I skipped a year planting brassicas. Just like a farmer you should be rotating your crops to get the best diet possible for your herd.
Mineral licks I typical add in the early spring and summer, I keep two sites going on 80 acres. By keeping track of how much I add and when, I know that “mineral lick 1” was started in 2007 and as of the fall of 2014 has had 3,400 pounds used. “Mineral lick 2” was started in the spring of 2009 and as of the fall of 2014 has gone through 2,500 pounds. These are good numbers to know, however, without the data it would only be a guess. Not only does keeping records help your wildlife, it also helps your wallet.
Population Survey
I like to keep population records because it’s fun to find out which deer are using my property? You will want to monitor population trends - our Missouri deer population became out of balance because we protected too many does over too many years. The population became 10 does to 1 buck when a preferred population is closer to even, like two does to one buck.
So, by estimating your density and your buck to doe ratio you can set your harvest goals for the season to come, it’s all about balancing the herd. So you harvested some deer last year, what did that do to your overall population? Maybe Epizootic Hemorrhagic Disease or Blue Tongue killed some deer in your area, what did that do? The coyotes are eating one fawn a day, how did that influence recruitment? By monitoring the deer population you can determine if your goals are a success or a failure.
All this put together will allow you to make sound management goals before the season begins. Maybe you don’t need to take any does, maybe you need to take five does. How can you make that decision without a deer population survey?
Keep these totals from year to year to observe the trends. This will let you know how your food plots and timber stand improvements are doing and will also confirm what you’re seeing in the field. You now know the number of deer, age structure and quality of bucks, the ratio of bucks to does and the number of fawns that have survived each year.
| Year | Number of Hours Hunted | County | Deer | Turkey | Coyote | Red Fox | Bobcat | Raccoon | Opossum |
| 1996 | 54 | Ripley | 4 | 9 | 1 | ||||
| 1997 | 50 | Ripley | 14 | 17 | 1 | ||||
| 1998 | 41 | Ripley | 12 | 10 | |||||
| 1999 | 76 | Ripley | 25 | 146 | 6 | 1 | |||
| 2000 | 70 | Ripley | 26 | 72 | 1 | ||||
| 2001 | 43.5 | Ripley | 20 | 18 | |||||
| 2002 | 62.5 | Ripley | 20 | 40 | |||||
| 2003 | 45.5 | Ripley | 52 | 153 | |||||
| 2004 | 76 | 5 Counties | 34 | 18 | |||||
| 2005 | 67.5 | Greene | 45 | 6 | 1 | 1 | |||
| 2006 | 34 | Greene | 36 | 75 | 3 | ||||
| 2007 | 47 | Bollinger | 29 | 54 | |||||
| 2008 | 69.5 | Bollinger | 39 | 46 | |||||
| 2009 | 59 | Bollinger | 48 | 34 | 1 | 2 | 1 | ||
| 2010 | 56 | Bollinger | 22 | 49 | 1 | ||||
| 2011 | 147 | Bollinger | 80 | 14 | 4 | 1 | |||
| 2012 | 68.5 | Bollinger | 32 | 49 | 2 | ||||
| 2013 | 91 | Bollinger | 26 | ||||||
| 2014 | 138 | Bollinger | 45 | 34 | 1 | 1 |
Observation Data
The Missouri Department of Conservation has a Bowhunters Wildlife Observation Survey that approximately 7,000 bowhunters participate in. This survey provides valuable information to assist the MDC in gauging the health of wildlife populations, such as deer and turkey, and helps staff make harvest management decisions by assessing trends in animal populations in an area.
One of my favorite things to do is keep track of your data in hours hunted, in A.M. and P.M. times. You can see a summary of my data from different counties over several seasons. This helps to see trends in your own population.
Game Camera Photos and Deer Movement
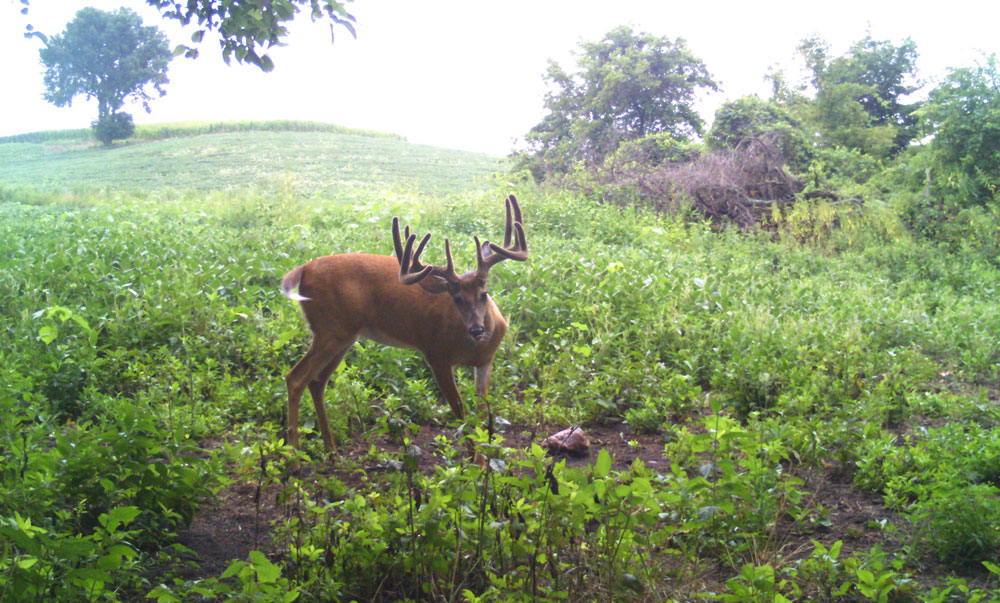
I have been using game cameras since they first hit the market and if you don’t keep track of your photos it can become a mess in a hurry. To give you an idea of how utilization has increased - in 2007 I shot 613 photos (35mm only), that has now increased to over 300,000 per year.
can be for game animal recruitment, and keeping records
to learn trends and what has been effective in the past will
only make you more efficient.
I also keep track for my research on deer moving during daylight for different periods. I have analyzed deer activity and movement patterns for over 25 years, based on thousands of daylight sightings and game camera shots of free-range animals, many of which have been published over the last 9 years. I keep my photos broken down into folders by year, then month (or half month) and during August by the week. Then I break it down by camera, then the most important images go into a folder I call "highlights."
You can get better age estimates on bucks on camera than you can in a few glimpses of them moving through the brush. Trail cameras definitely help with aging animals, both bucks and does. They make all estimates of density, buck to doe ratios and age structure that much more accurate. They are a must for a serious gamekeeper.
One last thing you should search your images for are daylight bucks – every animal has its own personality and if you are seeing photos of a buck frequently during daylight compared to a buck with no daylight photos, you might consider one buck “huntable” and the other may be much more difficult to kill…maybe if he makes a mistake during the rut.
Harvest Records
Some of the most important records are accounts of animals harvested. The whole purpose of the chase is the harvest. This will tell you how many people you have hunting over time, how many does you take in a given year, how the weights of your bucks have increased as a result of your management efforts and the real age of the deer you have taken. I keep track of hunters, the location hunted, date, whether it was a buck or doe, hen or gobbler, body weight, antler score, age off of tooth wear, and cementum annuli forensic tooth age from the lab.
Trapping Records
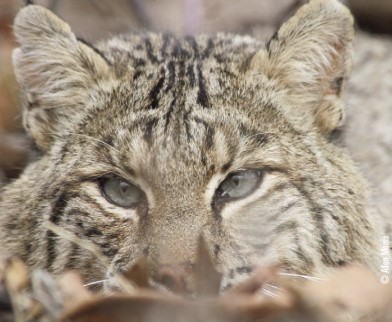
This is one of the most useful records that you will look back at years later so that you can see how many coyotes or bobcats you caught in years past and to help you with trends that will help you catch more. For trapping, I keep the dates, animal, which type of trap, male or female, weight of the animal and number of days trapping.
| Year | 2014-2015 | 2013-2014 | 2012-2013 | 2011-2012 | Totals |
| Bobcat | 4 | 3 | 4 | 2 | 13 |
| Opossum | 29 | 20 | 5 | 6 | 60 |
| Raccoon | 11 | 10 | 6 | 3 | 30 |
| Coyote | 4 | 1 | 3 | 8 | |
| Red Fox | 2 | 2 | |||
| Gray Fox | 0 | ||||
| Striped Skunk | 0 | ||||
| Days Trapping | 71 | 62 | 33 | 47 | 213 |
| Total Animals | 48 | 36 | 18 | 11 | 113 |
Collecting trapping data will help you to get to know your furbearers. You can compare trapping records to your game animal densities to show you whether your efforts are having an effect. Is trapping helping fawn recruitment or turkey numbers? This can be important information.
Sheds
Keeping track of shed antlers will tell you if antler growth is improving, how specific bucks have progressed and whether they are still alive to hunt again. Don’t forget to number your sheds, which I also keep in a log on my computer. The next thing I do is to put the month and year when I found each shed so I can look at a specific buck’s development and also as a judge to see if my overall management efforts are working.
Fawning Dates
If you happen to be in the woods working on your land you come upon a newborn fawn, it can tell you a lot, especially if you do this multiple times over numerous years you should be able to see a trend. By looking at the data I have collected, I have found a newborn on my property in three different years, May 22, 2011, May 24, 2013 and May 25, 2014. If you have these dates you can make an estimate of when breeding took place, which every hunter wants to know. With the gestation of a doe approximately 195 to 200 days, I know for those fawns to be born within a week of when I discovered them the does would have needed to conceive around November 7th through the 11th. Just before this time would be the chase phase and a great time to be in the woods.
Developing a Property Management Plan
All the different record keeping above will help you to develop and/or update a land/wildlife/forestry property management plan. Developing a management plan is a wise investment of time and money. It gives you a direction and a timeline to complete your objectives. You don’t take a long trip without a map or GPS, why would you take a trip over time without one? Basically you could call a management plan a “map for your property through time.” Just remember you are doing all this for yourself - have fun, write stuff down! In 10, 20 or 30 years from now you will be glad you did.


